This lab explored raster functions in the context of frac sand mining in Trempealeau County. Raster functions are powerful tools with a wide range of functions. These functions were used to determine suitable land for frac sand mines and land where mines may have a high environmental impact both considering a variety of factors. Using these findings, areas of high mine suitability with low negative impact were located. Note that only the southern portion of Trempealeau County was considered to cut down on processing time.
METHODS
First, geoprocessing environments were set up to only analyze the study area. Cell size defaults for rasters were set to 30 x 30 meters to ensure data integrity. A mask was used in the environment so all rasters created would have the same extent of lower Trempealeau County.
Land Suitability
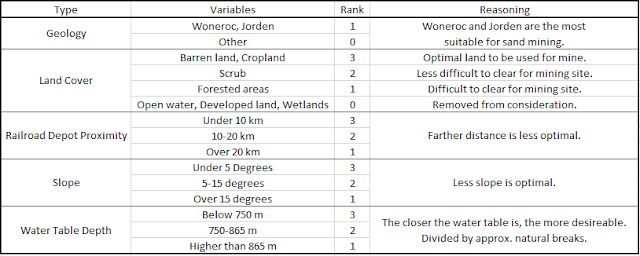
To find areas suitable for sand mines, a variety of factors were considered. These included geologic, land use, distance to railroads, low slope, and water table requirements. For each factor, land was ranked on a scale for how suitable it was based on each factor. This is outlined in the table below in figure 1.
 |
| Figure 1: Suitability factors |
Geology was based on whether the geology type was Woneroc or Jorden, which are the most suitable for mining. Geologies of these types were extracted as a raster.
Land cover uses were judged on a scale, where clear, open lands were the most suitable. The more difficult it is to clear an area, the less suitable the land was. Devloped land and open water were removed from consideration completely. The types were extracted as rasters
Next, railroad depot proximity was considered. The farther a mine is from a railroad depot, trucks will have to travel farther to drop off product. Areas closer to depots were given a higher suitability rank. Euclidean distance to railroad depots was calculated and the distances were ranked in a raster.
Next, slope was considered. Lower slopes would be considered optimal, as it would be easier to traverse the mine site with the necessary heavy equipment. Lower slopes were ranked as more suitable. Slope was extracted from a county DEM. A filter was used to remove some of the salt-and-pepper effect this produces. Slopes were reclassified to be ranked.
Lastly, water table depths were considered. Since mines use water in the mining process, it would be optimal to procure water at the site. The deeper the water table is, the more difficult that would be, thus deeper water tables were ranked as less suitable. Contours of water table depths were used to create a depth raster. These depths were reclassified to judge suitability.
Once the rasters for each factor were ready, a model was created to build an overall suitability raster. The model created is shown below in figure 2. The Raster Calculator SQL is as follows:
("%Geol_Suitable%" + "%NLCDreclass%" + "%RailDistFinal%" + "%SlopeSuitabilityFILTER%" + "%WTDsuitability%") * "%NLCDexclude%"
The SQL adds the factors together and multiplies this result by the exclusion areas. The areas excluded have a value of 0, with all other area having a value of 1 within the exclusion raster. This replaces the rank of excluded areas with a null value.
 |
| Figure 2: Model created for land suitability factors |
Environmental and Social Impact Consideration
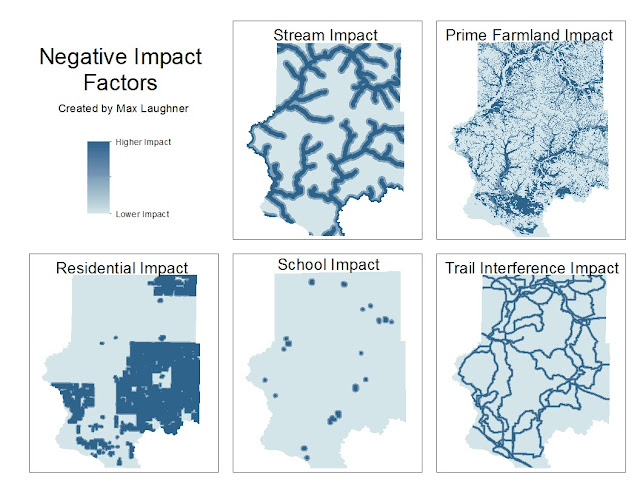
Solving for impact factors was completed in using the same workflow. The factors considered were impacts to streams, prime farmland, residential areas, schools, and trails. Once again, each factor was assigned a rank as shown below in figure 3. The higher the rank, the more impact the variable had.
 |
| Figure 3: Impact factors |
To avoid placing a mine on prime farmland, farmland data was used. This came as a vector which classified land's suitability for farmland. This polygon vector was converted to a raster and the suitability of farmland was ranked.
Next, residential impacts were assessed. Land use data was procured from the Trempealeau County Geodatabase. From here, land with residential use was extracted through a query. From here, the Euclidean Distance tool was used to determine distance from residential land. Zoning laws dictate that mines cannot be within 640 meters from residential properties. The farther they are, the lesser the noise and dust impact would be. These distances were ranked as a raster through the Reclassification tool.
For similar reasons to residential land, schools should also be a distance from sand mines. School locations were procured from querying parcel data of the county. From here, the same procedure as residential impacts was followed, only this allowed 1 km instead of 640 meters, as an extra distance from mines would be advisable for schools.
Finally, locations were determined to minimize negative impact on nature trails in the county. A trail vector was used with a variety of trail types (recreational, horse, bike, and snowmobile). The Euclidean Distance tool was used to create a distance raster for trails, and this was reclassified to assign ranks to locations.
Once the rasters for each impact factor were ready, a model was created to build an overall suitability raster. The model created is shown below in figure 4. The Raster Calculator SQL is as follows:
"%StreamImpact1%"+"%PrimeFarmImpact1%" + "%ResImpact1%" + "%SchoolImpact1%" + "%TrailImpact3%"
The SQL adds the factors together to create ranked locations.
 |
| Figure 4: Model created for impact factors |
There were some areas that were excluded from consideration for mine locations. As previously mentioned, developed land and open water were excluded. Also excluded was areas visible from prime recreational areas. This was done because Trempealeau County parks are popular hiking destinations. The area used for this was the Perrot State Park Trail. A vector line of this trail was used. The Viewshed spatial tool was used in conjunction with the county DEM to determine what areas are visible from the Perrot Trail. This created a raster with pixel values of 0 (visible) and 1 (not visible). Both this exclusion factor and the previously discussed factor are shown below in figure 5.
 |
| Figure 5: Excluded areas |
("%Mine_Suitatability1%" - "%Mine_Impact1 (2)%" + 10) * ("%TrailViewshedReclass1%" * "%NLCDexclude%")
The SQL adds the the suitable land factors and subtracts the areas of ranked negative impacts. 10 is added to this sum to keep the numbers positive to properly represent excluded areas as on the low end of rankings. This result is multiplied by both the exclusion factors discussed previously in this section. Since these exclusion factors have only values of 1s and 0s, this will assign a 0 to any areas that should be excluded.
 |
| Figure 6: Model for suitable mine locations |
Python Script to Assign Weights to Factors
A Python script was also developed to weight a certain factor in the model. This script can be viewed here under Script 3.
RESULTS AND DISCUSSION
The land suitability factors are shown below in figure 7. A raster was created from each factor as described in detail in the methods section. The darker the area, the better suited it is for a sand mine.
 |
| Figure 7: Land suitability factors |
 |
| Figure 8: Sum of suitability factors |
Next, the negative impact factors are shown below in figure 9. The darker the area, the more negative the impact for that area is.
 |
| Figure 9: Negative impact factors |
 |
| Figure 10: Sum of impact factors |
Finally, the map created for recommended mine locations is shown below in figure 11. This takes into account the previously discussed factors for successful mine locations along with areas of negative environmental and social impact. Many areas on the southern portion of the county are inadvisable as mine locations. This is due to those areas being part of the river or state park area. Lines of excluded areas throughout the map show rivers and major roadways that are surrounded by developed land. The best locations found for potential sand mines are largely in the western side of the county. There are also many areas of high rank scattered in the southern area.
 |
| Figure 11: Recommended areas for sand mines |
CONCLUSION
Raster analysis functions are a robust option for data analysis. The Raster Calculator tool, while simple, is vital in connecting multiple data sets. The multitude of raster analysis tools available are vital to any raster-based application. While some factors were simplified for the purpose of this lab, real-world workflows are similar to the workflow followed throughout the exercise.
No comments:
Post a Comment